Matteo He.
← Back to Learning to Read Out

Learning to Read Out · Research explorer

How readout features develop

A language model uses learned output weights, called its readout, to turn internal representations into scores for possible next tokens: words or pieces of words. These weights change during training. I developed trajectory crosscoding to track patterns in them, called features, across saved training checkpoints.

The figures below follow these features and test how they relate to predictions. The central question is whether information becomes detectable inside a model before its readout can express it reliably. That distinction matters when we use a model’s answers to judge what it has learned.

Inside the readout

Features through training

Paper figure ↗
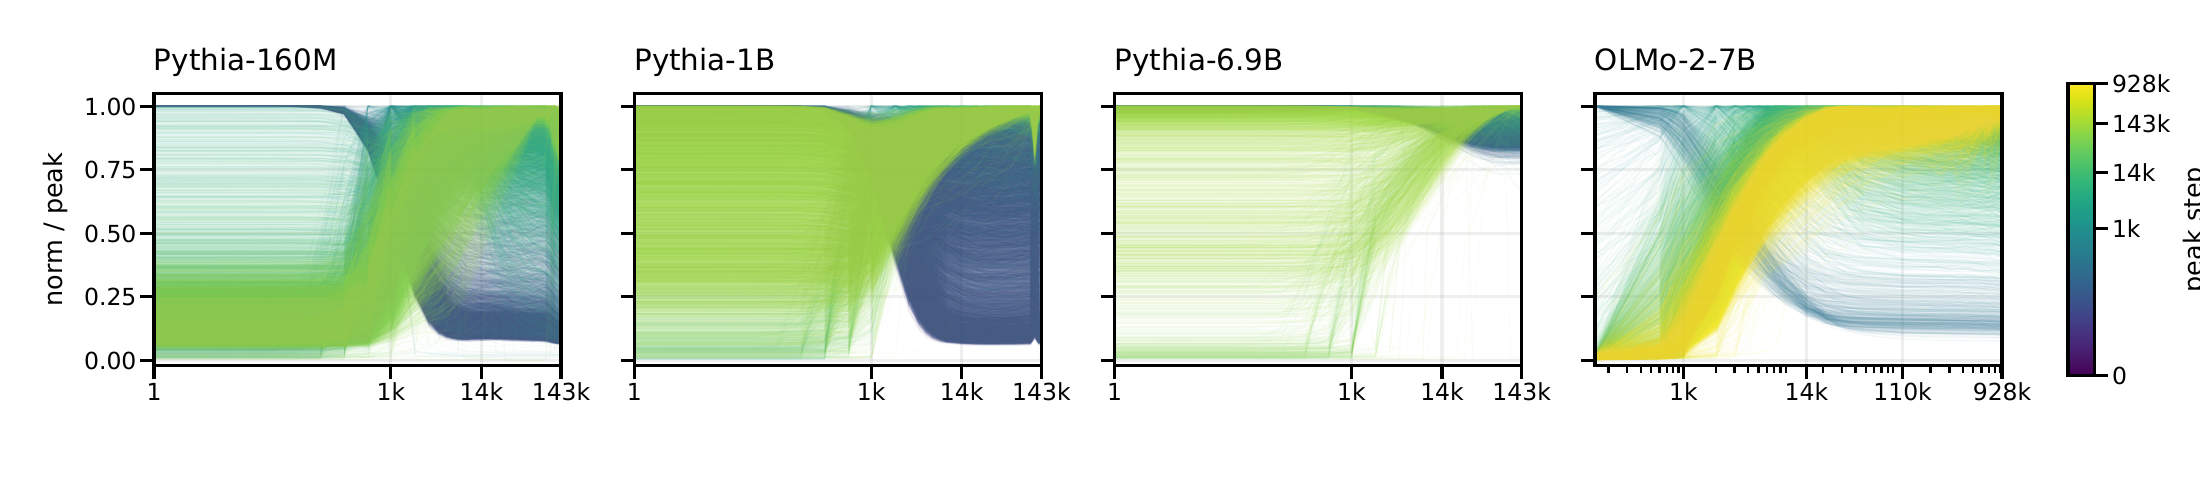
Feature trajectories in Pythia-160M, Pythia-1B, Pythia-6.9B and OLMo-2-7B show features peaking early and fading, emerging later, or persisting.
Each line follows one feature through training. Height measures the size of its fitted vector, called the decoder norm, scaled to that feature’s own maximum. Colour shows when it peaks. A high point indicates that the vector is large relative to its other checkpoints; it does not measure importance for predictions.
How to read these figures

Choose a model and move the training slider or replay the checkpoints. Hover, tap, or focus the chart and use the arrow keys to inspect a curve. In the feature examples, select Early, Peak, or Final to highlight that checkpoint and its tokens.

Feature curves show decoder norms divided by each feature’s own maximum. Their height shows change over time, not importance relative to other features. The trajectory explorer samples 1,200 active features per model; the original figure shows the full populations. Straight lines join measured checkpoints, and the training axis is logarithmic. Each model has its own training schedule.

Token lists follow the paper’s ordering, with display whitespace trimmed. Other plots retain the values and baselines of the paper figures; exact values are provided where tabular summaries are useful. Colours and marker shapes identify each condition.

02 · Individual features

What do individual features correspond to?

To help interpret a feature, we inspect the tokens most associated with it at different stages of training. Select Early, Peak, or Final to see how the list changes alongside the curve. Labels such as “Chemistry” summarize these token lists and offer a qualitative interpretation.

Quantity words

Pythia-1B · Feature 1,227 · Peak at step 1,000

Quantity words: measured decoder norm relative to its peak, across training. Peak at step 1,000.Decoder norm / own peak00.5111001k14k143kTraining step · log scale

Peak · step 1,000 · relative norm 1.000

Early Step 16

performermphlineassistsHalldiagramsdoubtCruPPARfortfearedbackwardrightsinchesnpmjsdoctrinestrainingengineeringlivelihood515

Peak Step 1,000

mphkilometersmilliongramsmetrespoundspercentlbskilometresincheskmcentscentimeterskilogramshect%.secondstrillionbillionmiles

Final Step 143,000

millionbillionpoundstrillionmphthousandpercentinchesMHzlbsMillionkmppmmilesHzkHzGHzcroremillionkDa

Chemistry fragments

Pythia-1B · Feature 15,921 · Peak at step 2,000

Chemistry fragments: measured decoder norm relative to its peak, across training. Peak at step 2,000.Decoder norm / own peak00.5111001k14k143kTraining step · log scale

Peak · step 2,000 · relative norm 1.000

Early Step 16

amineTouchemptyreacting))*elliarspreparetrycysteineabelianethylentin}).COMPTakeseventeenthSupport313inflammatory

Peak Step 2,000

hydroxylalkylestersaromaticalcohphenylanionestersulfanhydrdehydrogenacylcarboxhydroxhydroxyarylheterocymethylaminenitrogen

Final Step 143,000

alkylaminephenylcarboxhydroxylheterocyaromaticarylbenzalkphenolicsulfestermethylcationacidestersoxidethyldimethyl

Cell biology fragments

Pythia-1B · Feature 2,228 · Peak at step 116,000

Cell biology fragments: measured decoder norm relative to its peak, across training. Peak at step 116,000.Decoder norm / own peak00.5111001k14k143kTraining step · log scale

Peak · step 116,000 · relative norm 1.000

Early Step 16

fibroblLRmutagensettledexplainingativesleneckLabelMississippilevelconfirmsimmunoglobnanopprognostichaematfilmmcontrib34Lennamyg

Peak Step 116,000

apoptoligonuclecytotoxfibroblprophyltriglycercarbohprogencerebhippocampaneurdeletermitochondbiomedantioxidneutrophimmunodpregnneuropreperto

Final Step 143,000

apoptoligonuclecytotoxfibroblhippocampprogenprophylantioxidtumorigenmitochondtriglycercarbohneuropresilimmunohistcerebepigensemiconosteoporpleth

Three selected examples from the Pythia-1B dictionary of 24,576 features. Select Early, Peak, or Final to connect a point on the curve with its token list.

03 · Interventions

Do these features affect predictions?

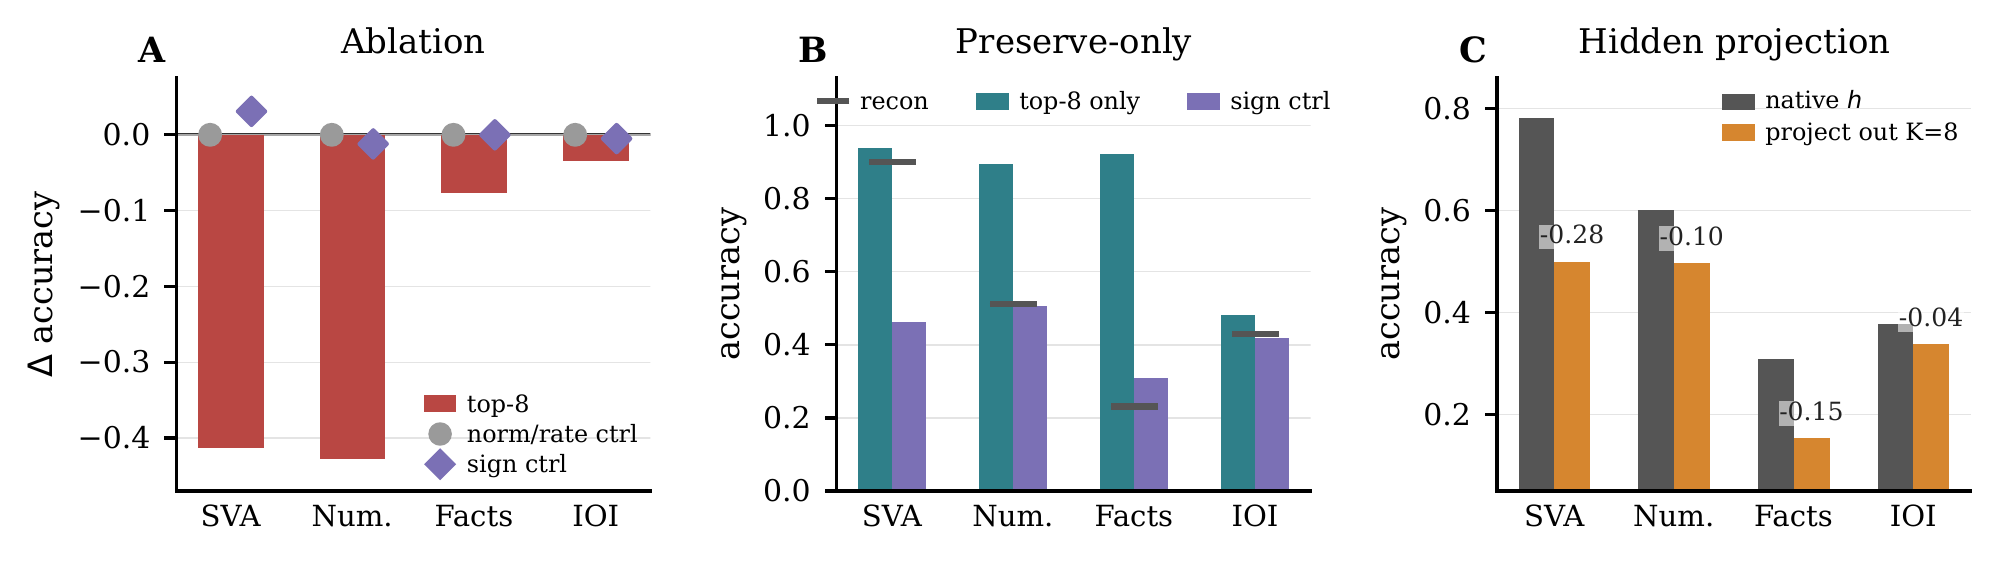
The agreement test asks whether the readout prefers a verb that matches the subject: for example, “The keys are” over “The keys is”. Removing eight selected feature contributions from the reconstructed readout reduced accuracy from 90.0% to 48.7%. Removing features chosen as matched controls left accuracy at 90.0%.

The panels compare three interventions: remove the selected contributions from the readout, keep only those contributions, or remove the corresponding directions from the internal representations. These tests help distinguish a feature’s association with a task from its effect on the answer scores.

Remove selected directions

  • ●Eight selected directions
  • ■Norm and rate control
  • ▲Sign control
Remove selected directions-40-200Subject–verb agreementSubject–verb agreement, Eight selected directions: -41.3 percentage pointsSubject–verb agreement, Norm and rate control: 0.0 percentage pointsSubject–verb agreement, Sign control: 3.1 percentage pointsNumeric comparisonNumeric comparison, Eight selected directions: -42.8 percentage pointsNumeric comparison, Norm and rate control: 0.0 percentage pointsNumeric comparison, Sign control: -1.2 percentage pointsRelational facts*Relational facts*, Eight selected directions: -7.7 percentage pointsRelational facts*, Norm and rate control: 0.0 percentage pointsRelational facts*, Sign control: 0.0 percentage pointsIndirect object identificationIndirect object identification, Eight selected directions: -3.5 percentage pointsIndirect object identification, Norm and rate control: 0.0 percentage pointsIndirect object identification, Sign control: -0.5 percentage pointsChange in accuracy · percentage points
Exact values
TaskConditionChange in accuracy · percentage points
Subject–verb agreementEight selected directions-41.3
Subject–verb agreementNorm and rate control0.0
Subject–verb agreementSign control3.1
Numeric comparisonEight selected directions-42.8
Numeric comparisonNorm and rate control0.0
Numeric comparisonSign control-1.2
Relational facts*Eight selected directions-7.7
Relational facts*Norm and rate control0.0
Relational facts*Sign control0.0
Indirect object identificationEight selected directions-3.5
Indirect object identificationNorm and rate control0.0
Indirect object identificationSign control-0.5

Keep only selected directions

  • ●Eight selected directions
  • ■Reconstructed baseline
  • ▲Sign control
Keep only selected directions0255075100Subject–verb agreementSubject–verb agreement, Eight selected directions: 93.8%Subject–verb agreement, Reconstructed baseline: 90.0%Subject–verb agreement, Sign control: 46.3%Numeric comparisonNumeric comparison, Eight selected directions: 89.4%Numeric comparison, Reconstructed baseline: 51.2%Numeric comparison, Sign control: 50.7%Relational facts*Relational facts*, Eight selected directions: 92.3%Relational facts*, Reconstructed baseline: 23.1%Relational facts*, Sign control: 30.8%Indirect object identificationIndirect object identification, Eight selected directions: 48.1%Indirect object identification, Reconstructed baseline: 42.9%Indirect object identification, Sign control: 42.0%Accuracy · %
Exact values
TaskConditionAccuracy · %
Subject–verb agreementEight selected directions93.8
Subject–verb agreementReconstructed baseline90.0
Subject–verb agreementSign control46.3
Numeric comparisonEight selected directions89.4
Numeric comparisonReconstructed baseline51.2
Numeric comparisonSign control50.7
Relational facts*Eight selected directions92.3
Relational facts*Reconstructed baseline23.1
Relational facts*Sign control30.8
Indirect object identificationEight selected directions48.1
Indirect object identificationReconstructed baseline42.9
Indirect object identificationSign control42.0

Remove directions from hidden states

  • ●Native baseline
  • ■After projection
Remove directions from hidden states0255075100Subject–verb agreementSubject–verb agreement, Native baseline: 78.1%Subject–verb agreement, After projection: 50.0%Numeric comparisonNumeric comparison, Native baseline: 60.1%Numeric comparison, After projection: 49.7%Relational facts*Relational facts*, Native baseline: 30.8%Relational facts*, After projection: 15.4%Indirect object identificationIndirect object identification, Native baseline: 37.7%Indirect object identification, After projection: 33.8%Accuracy · %
Exact values
TaskConditionAccuracy · %
Subject–verb agreementNative baseline78.1
Subject–verb agreementAfter projection50.0
Numeric comparisonNative baseline60.1
Numeric comparisonAfter projection49.7
Relational facts*Native baseline30.8
Relational facts*After projection15.4
Indirect object identificationNative baseline37.7
Indirect object identificationAfter projection33.8
Original paper figure ↗

*Relational facts uses 26 examples, with the same examples for selection and evaluation. Treat this result as exploratory.

Pythia-1B, with hidden states fixed at step 1,000. The readout interventions use the reconstructed final readout; hidden state projection uses the native step-1,000 readout, so the baselines differ. These tests concern readout margins on fixed hidden states.

Evaluation scope

Feature selection and evaluation use separate halves of the examples for agreement, numeric comparison, and indirect object identification. The relational facts set contains only 26 examples and uses the same examples for selection and evaluation, so that result is exploratory.

Some reconstructed readout baselines are near or below chance at this particular pairing of early hidden states and final readout. Those rows need to be read relative to their own reconstruction baselines. The results do not establish how the interventions affect freely generated text.

04 · Capability evaluation

Information was detectable before the readout expressed it

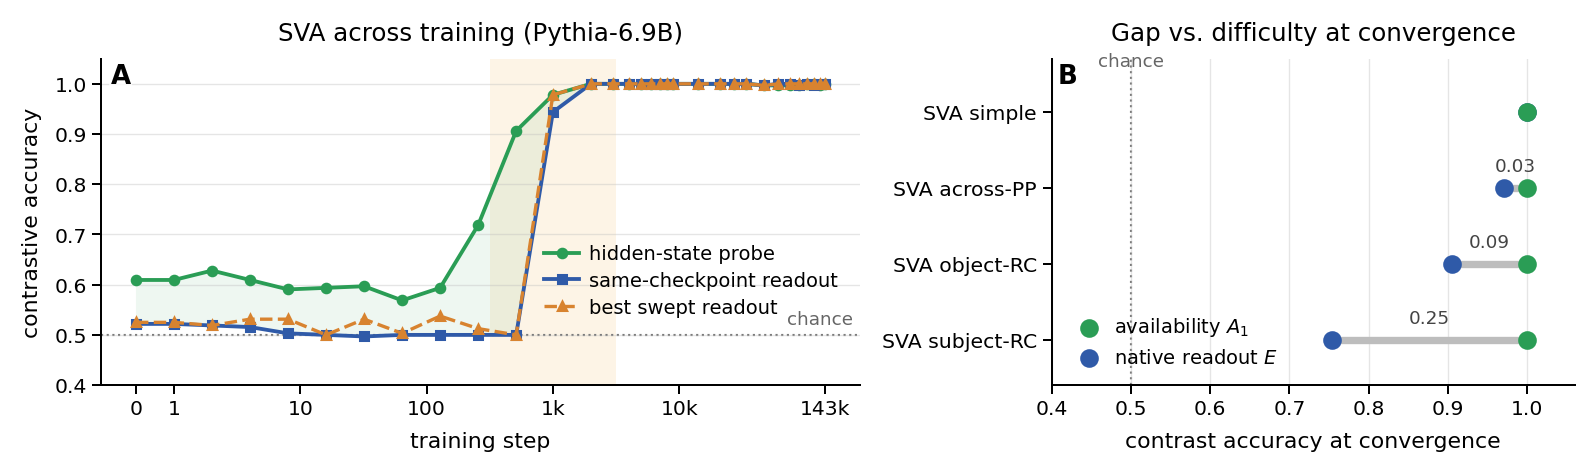
A separate classifier, called a probe, tests whether the internal representations contain information about whether a subject is singular or plural. We compare its accuracy with the model’s own readout choosing between the corresponding verb forms. “Native readout” means the model’s readout from the same training checkpoint.

The probe recovered this information before the readout reliably chose the correct verb. The gap closed for simple sentences, but persisted at the end of training when additional phrases or clauses separated the subject from its verb. Recovering information with a probe does not, by itself, show that the model uses it.

During training

  • ●Hidden state probe
  • ■Native readout
  • ▲Best swept readout
Agreement information is detectable before the native readout expresses it.507510001101001k10k143kHidden state probe: 60.94%Hidden state probe: 60.94%Hidden state probe: 62.81%Hidden state probe: 60.94%Hidden state probe: 59.06%Hidden state probe: 59.37%Hidden state probe: 59.69%Hidden state probe: 56.87%Hidden state probe: 59.37%Hidden state probe: 71.87%Hidden state probe: 90.63%Hidden state probe: 97.81%Hidden state probe: 100.00%Hidden state probe: 100.00%Hidden state probe: 100.00%Hidden state probe: 100.00%Hidden state probe: 100.00%Hidden state probe: 100.00%Hidden state probe: 100.00%Hidden state probe: 100.00%Hidden state probe: 100.00%Hidden state probe: 100.00%Hidden state probe: 100.00%Hidden state probe: 100.00%Hidden state probe: 99.69%Hidden state probe: 99.69%Hidden state probe: 99.69%Hidden state probe: 99.69%Hidden state probe: 100.00%Hidden state probe: 100.00%Hidden state probe: 99.69%Hidden state probe: 100.00%Native readout: 52.19%Native readout: 52.19%Native readout: 51.88%Native readout: 51.56%Native readout: 50.31%Native readout: 50.00%Native readout: 49.69%Native readout: 50.00%Native readout: 50.00%Native readout: 50.00%Native readout: 50.00%Native readout: 94.37%Native readout: 100.00%Native readout: 100.00%Native readout: 100.00%Native readout: 100.00%Native readout: 100.00%Native readout: 100.00%Native readout: 100.00%Native readout: 100.00%Native readout: 100.00%Native readout: 100.00%Native readout: 100.00%Native readout: 100.00%Native readout: 99.69%Native readout: 100.00%Native readout: 100.00%Native readout: 99.69%Native readout: 100.00%Native readout: 99.69%Native readout: 100.00%Native readout: 100.00%Best swept readout: 52.50%Best swept readout: 52.50%Best swept readout: 51.88%Best swept readout: 53.13%Best swept readout: 53.13%Best swept readout: 50.00%Best swept readout: 53.13%Best swept readout: 50.31%Best swept readout: 53.75%Best swept readout: 51.25%Best swept readout: 50.00%Best swept readout: 97.81%Best swept readout: 100.00%Best swept readout: 100.00%Best swept readout: 100.00%Best swept readout: 100.00%Best swept readout: 100.00%Best swept readout: 100.00%Best swept readout: 100.00%Best swept readout: 100.00%Best swept readout: 100.00%Best swept readout: 100.00%Best swept readout: 100.00%Best swept readout: 100.00%Best swept readout: 99.69%Best swept readout: 100.00%Best swept readout: 100.00%Best swept readout: 100.00%Best swept readout: 100.00%Best swept readout: 100.00%Best swept readout: 100.00%Best swept readout: 100.00%Accuracy · %Training step

Dashed horizontal line: 50% chance accuracy. The swept readout is the best alternative checkpoint readout in the sweep.

At the end of training

  • ●Hidden state probe
  • ■Native readout
The probe/readout gap persists on harder grammatical dependencies.5075100Simple agreementProbe: 100.00%Native readout: 100.00%Across a prepositional phraseProbe: 100.00%Native readout: 97.15%Across an object relative clauseProbe: 100.00%Native readout: 90.50%Across a subject relative clauseProbe: 100.00%Native readout: 75.42%Accuracy at convergence · %
Exact values
TaskProbe %Readout %Gap in points
Simple agreement100.00100.000.00
Across a prepositional phrase100.0097.152.85
Across an object relative clause100.0090.509.50
Across a subject relative clause100.0075.4224.58
Original paper figure ↗

Pythia-6.9B. Availability is measured by a linear probe; expression is measured by the readout’s preference between the answer tokens. Probe decodability alone does not establish that the model uses that information in its behavior.

05 · Controlled training

A faster readout learning rate shifted reorganization earlier

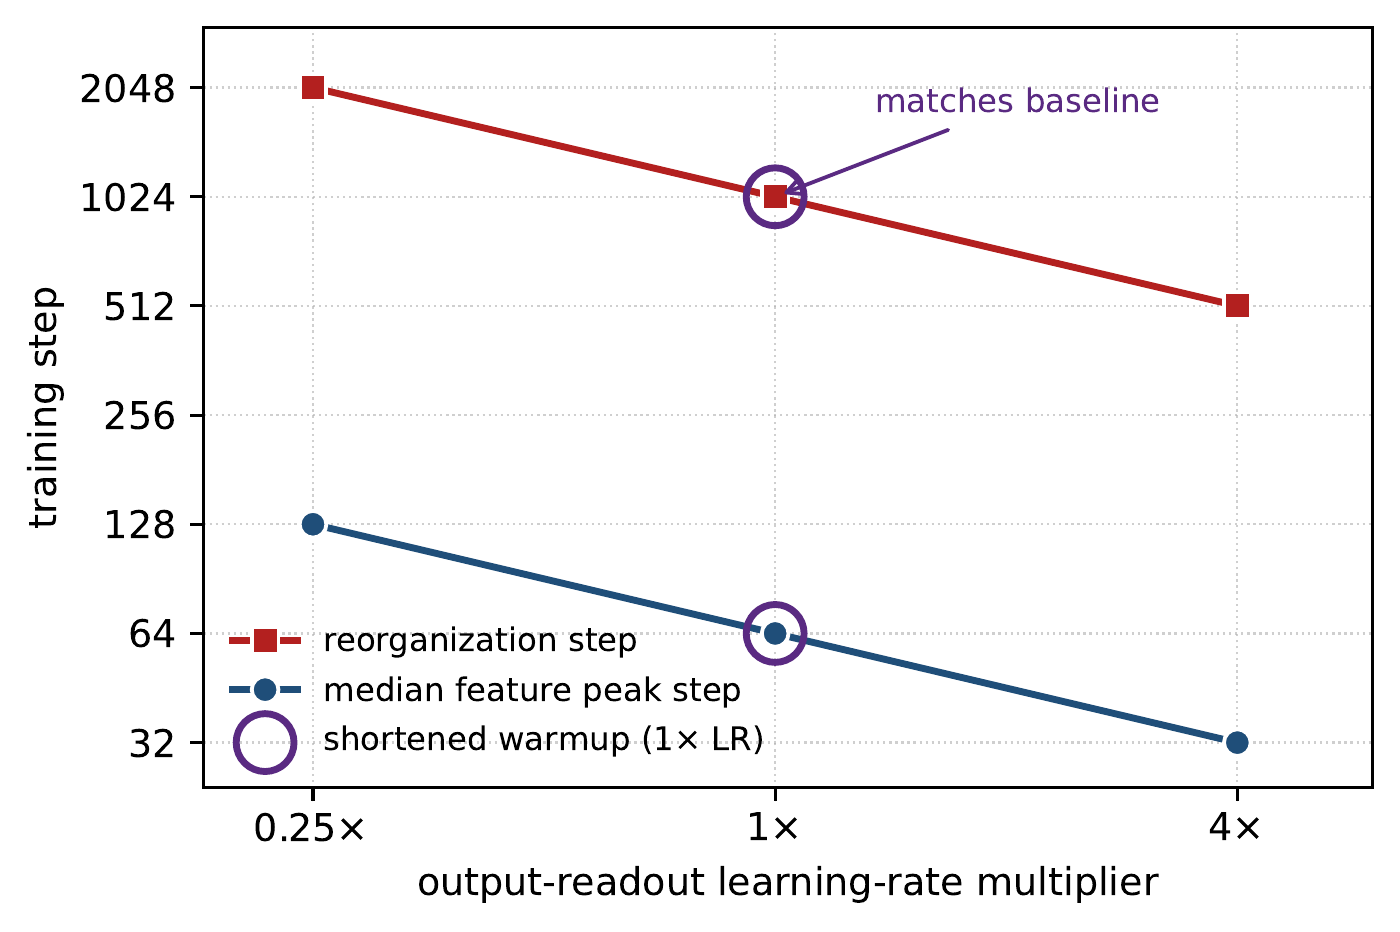
Does the pace of readout learning affect when its features change? The learning rate controls the size of weight updates. In these control runs, each fourfold increase in the readout learning rate halved the training step at which the measured reorganization occurred: a period of change in the feature population.

Shortening warmup, the initial period when the learning rate gradually increases, left the timing unchanged at the baseline rate.

Four runs of a model with 31 million parameters, sharing initialization and data order: three learning rates and a shortened warmup control. One run and one crosscoder fit per condition. Final validation losses agreed within 0.06 nats.
Learning rate sets the timing

  • ●Reorganization
  • ■Median feature peak
  • ○Shortened warmup (outline)
Each fourfold learning rate increase halves the reorganization step.326412825651210242048Reorganization: step 2,048Reorganization: step 1,024Reorganization: step 512Shortened warmup matches baseline: step 1024Median feature peak: step 128Median feature peak: step 64Median feature peak: step 32Shortened warmup matches baseline: step 640.25×1×4×Training step · log scaleReadout learning rate multiplier
Exact values
MultiplierReorganization stepMedian peak step
0.25×2048128
1×102464
4×51232
1×, short warmup102464
Original paper figure ↗
← Back to the project summaryExplore the code ↗

Research figure